
Colorado data centers map
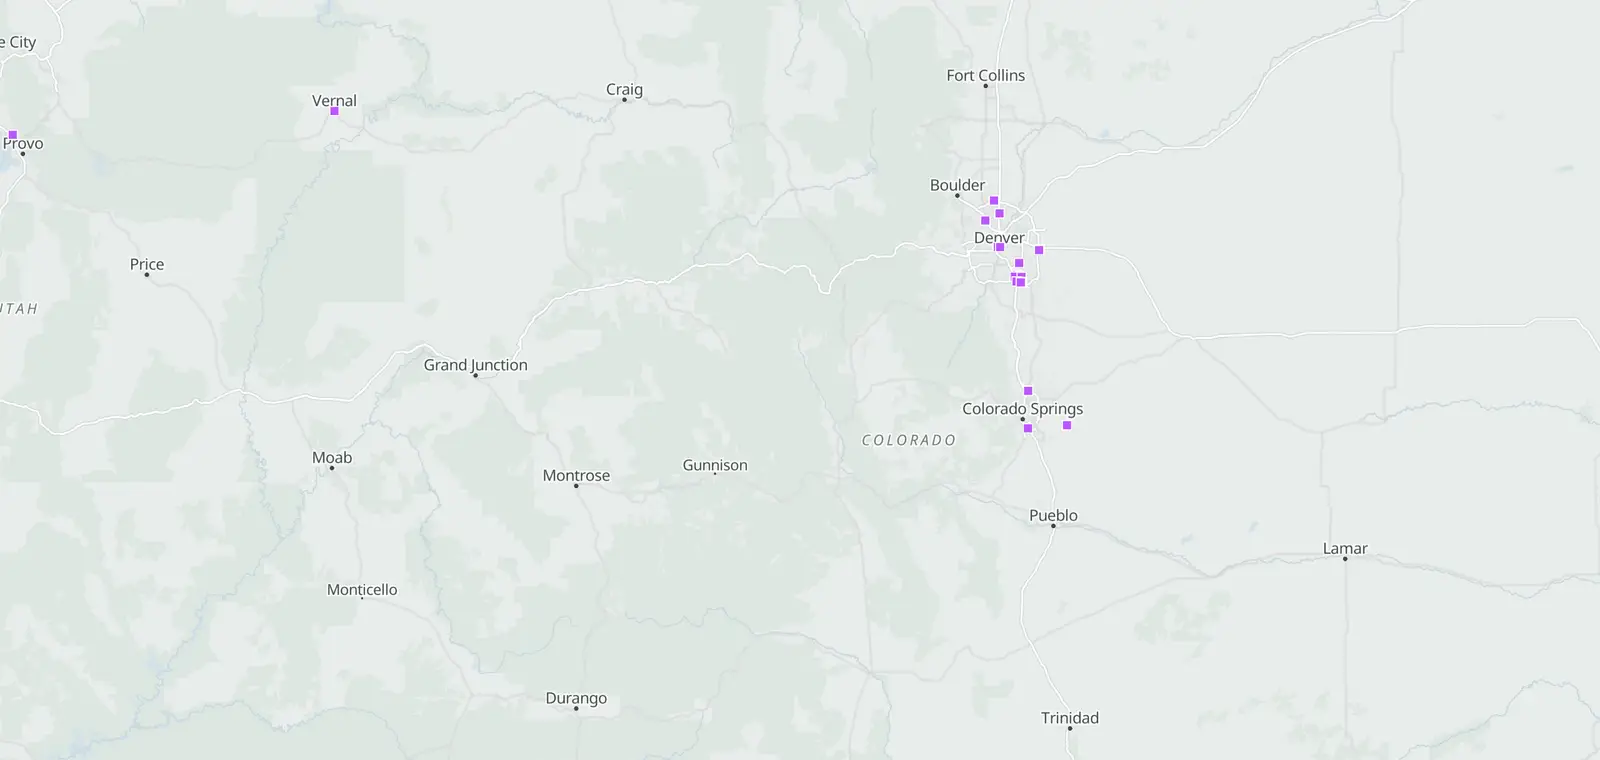
Colorado has 27 mapped data center buildings, the 16th most of any state. Arapahoe County has the most: 11. Businesses pay 12.37¢ per kWh for power, 7% below the US average. Business power use fell 0.8% from 2019 to 2025; the US grew 10.5%.
- 27mapped data center buildings
- 11in Arapahoe County, the most
- 12.37¢per kWh for businesses7% below the US average
About mapped buildings
Buildings and sites that OpenStreetMap volunteers have tagged as data centers. It counts mapped objects, not an official register, so some data centers are not on it yet.
About business power prices
This is the average price businesses paid for power in Colorado in 2025. A kilowatt-hour (kWh) is the power a 1,000-watt heater uses in one hour.
“Businesses” is the commercial group in the US Energy Information Administration's figures: offices, stores and most data centers. Some large data centers buy power as industry instead.
© OpenStreetMap contributors · © OpenMapTiles
AI campuses: Epoch AI, CC BY 4.0 (Nov 7, 2026), changes noted
© OpenStreetMap contributors · Addresses: Photon
Your location stays on your device.
What the marks mean
Operating: a building mapped as a data center in OpenStreetMap, in use today. As of Nov 6, 2026.
Proposed to under construction, paused, withdrawn or canceled: a planned project and the stage in its latest public record. As of Nov 7, 2026.
About the stages: a project moves from Proposed to Rezoning filed, Approved, Permitted and Under construction. Some stop: Paused, Withdrawn or Canceled.
AI campus: a large AI campus that is not running yet. As of Nov 7, 2026.
Campuses and projects not placed at their street address are listed, not mapped.
Each kind of mark is counted on its own, and the counts are never added together.
Which Colorado counties have the most data centers?
Arapahoe County has the most mapped buildings: 11. Douglas County is next, with 6.
Buildings mapped as data centers, per county
- None
- 1
- 2–4
- 5–9
- 10–24
How many in each county?
Which natural risks do these counties face?
About the risk ratings
FEMA's National Risk Index scores each county for each natural hazard from 0 to 100, against every county in the US. The score starts from the expected annual loss: the damage a hazard is likely to cause in an average year. It also weighs how many people could be hurt and how well the area can bounce back.
Ratings run from very low to very high.
“Rate high” means relatively high or very high.
All 7 counties with mapped data centers rate high or very high for at least one natural hazard. Lightning is the most common, with 7.
What does power cost in Colorado, and how fast is demand growing?
Businesses pay 12.37¢ per kWh, 7% below the US average, and their power use fell 0.8% from 2019 to 2025.
What do businesses pay for power?
12.37¢ per kWh in 2025, the 24th highest of 50 states and DC.
Is Colorado's power demand rising?
About business power use
This is the power sold to businesses each year, the commercial group in the US Energy Information Administration's figures. Most data centers are in it, so a fast rise often means new data centers, but offices and stores count too.
Colorado: 21.11 terawatt-hours (TWh) in 2019, 20.94 TWh in 2025. One TWh is a billion kWh.
No. Business power use fell 0.8% from 2019 to 2025; the US grew 10.5%.
What makes Colorado's power?
About the power mix
This is where the power generated in Colorado came from in 2025: each source's share of what its power plants made, 56.6 terawatt-hours (TWh) in all. Small rooftop solar panels are not counted.
“Other sources” is the agency's catch-all group.
Natural gas made 32% of the power generated in Colorado in 2025; wind made 30%.
Under 1% each: other biomass, pumped storage, other sources and petroleum.
How much new power is proposed in Colorado?
About proposed power plants
These are new power plants that companies have told the US Energy Information Administration they plan to open from 2026 to 2030. Plans can change or be dropped.
Sizes are net summer capacity: the most power a plant can send to the grid on a hot summer day. Each bar's length is its part of all the proposed power.
Companies have proposed 7,209 MW of new power plants for 2026 to 2030; solar is the largest source, 2,738 MW.
For scale, Colorado's power plants could deliver 20,913 MW on a summer day in 2025.
Which grid serves Colorado, and what are its water and hazard risks?
Utilities run their own grid areas for all of Colorado's power sales. 3 natural hazards rate very high for Colorado against other states.
Who runs Colorado's power grid?
About the grid
A grid operator, called an ISO or RTO, runs the high-voltage power lines and the power market for a whole region. The share is how much of the state's 2025 power sales were made inside its area.
Where there is none, each utility runs its own part of the grid.
No grid operator: each utility runs its own part of the grid, for all of 2025 power sales.
How much water do Colorado's power plants use?
About water taken in and used up
Taken in is the water power plants draw from rivers, lakes, wells or the sea to cool. Used up is the part that does not go back: most of it evaporates.
This is the water power plants use, not the water data centers use.
The 11 power plants in Colorado that report their cooling water used up 10.9 billion gallons in 2024, 11% of the 97.3 billion they took in.
Which hazards cost Colorado most?
About expected annual loss
FEMA's National Risk Index estimates each natural hazard's expected annual loss: the damage it is likely to cause in an average year. It rates each state against the other states, from very low to very high.
Hazards with the same rating are in the order of FEMA's score. Because each hazard is compared with other states, one can rate higher here and still cost fewer dollars than another.
Not rated: coastal flooding (not applicable), hurricane (not applicable) and tsunami (not applicable).
Lightning rates highest for Colorado against other states: very high for the damage it is likely to cause in an average year.
- Very highLightning, winter weather and avalanche
- Relatively highHail, wildfire and cold wave
- Relatively moderateLandslide, drought, inland flooding, tornado and strong wind
- Relatively lowEarthquake, heat wave and ice storm
- Very lowVolcanic activity
Who runs Colorado's data centers?
About this count
Each building counts once, by the operator named in OpenStreetMap. 9 buildings have no operator named.
DataBank and Flexential tie for the most mapped buildings: 4 each.
Show 5 more operatorsShow fewer
More about Colorado data centers
Questions about Colorado data centers
How many data centers are in Colorado?
Colorado has 27 data center buildings mapped in OpenStreetMap, the 16th most of any state, as of November 6, 2026. These counts are kept apart.
What county in Colorado has the most data centers?
Arapahoe County has the most: 11 data center buildings. They are mapped in OpenStreetMap. That is as of November 6, 2026. Douglas County is next, with 6.
Sources and updates
How this page was made: CamsAhead writes each page type once, then fills it with this place's data from the sources below.
- OpenStreetMap contributors: data center buildings, as of November 6, 2026; Open Database License (ODbL) 1.0, free copy on request.
- U.S. Energy Information Administration (EIA): Form EIA-861 (released Oct 2026) and Form EIA-861 2025 detailed data (released Oct 2026): business power prices and sales by state, grid operators and utilities by county; retrieved October 31, 2026.
- U.S. Energy Information Administration (EIA): Forms EIA-923/906/920 (released Sep 2026): power generated by source, 2025; retrieved October 31, 2026.
- U.S. Energy Information Administration (EIA): Form EIA-860 (released Sep 2026): power plants proposed for 2026 to 2030; retrieved October 31, 2026.
- U.S. Energy Information Administration (EIA): Form EIA-860 (released Sep 2026): power plant capacity by state, 2025; retrieved October 31, 2026.
- U.S. Energy Information Administration (EIA): thermoelectric cooling water data 2024, Forms EIA-860 and EIA-923 (retrieved Oct 2026): power plant cooling water by state.
- FEMA: National Risk Index v1.20 (December 2025), NRI_Table_Counties and NRI_Table_States: natural hazard ratings by county and expected annual loss by state; retrieved October 31, 2026. This product uses the Federal Emergency Management Agency's OpenFEMA API, but is not endorsed by FEMA. The Federal Government or FEMA cannot vouch for the data or analyses derived from these data after the data have been retrieved from the Agency's website(s).
CamsAhead's project records cover Prince William County, Virginia, not Colorado.
How CamsAhead counts cameras · Report a problem · Report a camera