
 CamsAhead.com
Plate readers © OpenStreetMap contributors (ODbL) · © OpenMapTiles
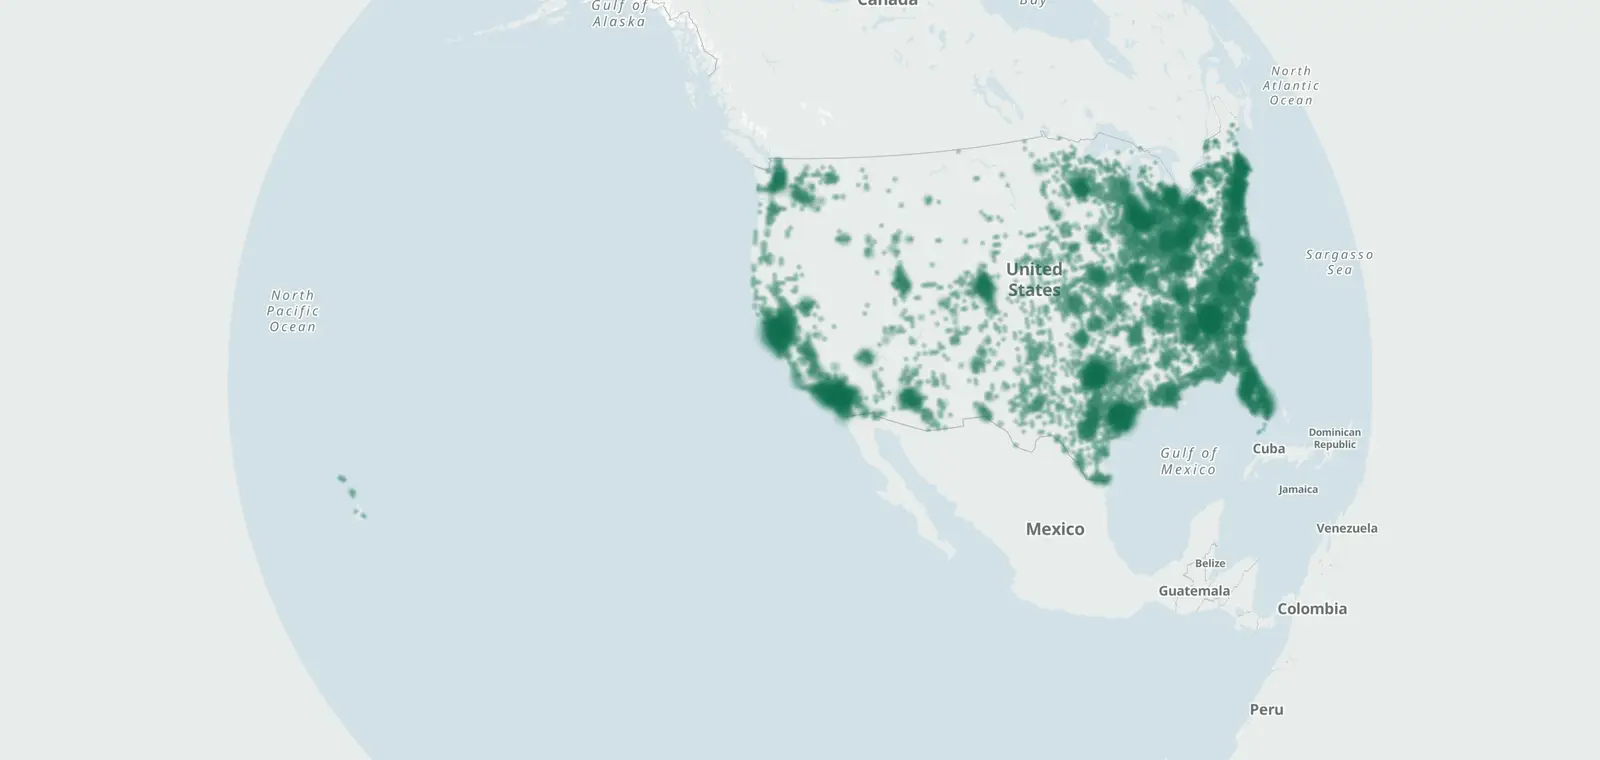
116,710 plate readers are tagged Flock Safety on the map in 50 states and DC, as of November 7, 2026. A point is not proof it is there today.
A Flock camera reads plates, not speed. A plate reader keeps a record of each car that passes. Whoever runs it sets how long, within state law.
What is a Flock camera? · All license plate readers · Flock camera maps compared
Flock cameras mapped over time
Of the 116,710 Flock-tagged plate readers on the map on November 7, 2026, about 41 were first mapped by the end of 2022. Mapping picked up in November 2024 (2,579 that month) and was busiest in August 2026 (11,686). California has the most, 17,265. Georgia has the most per person, 83.7 per 100,000 people.
116,710
Flock-tagged plate readers on the mapNov 7, 2026estimated
+568 first mapped Nov 1 to 7
 CamsAhead.com
Early months are approximate.
- 1Nov 2024: 2,579 first mapped in one month, up from about 27 a month in the year before.
- 2Nov 2025: 9,312 first mapped, a new monthly high.
- 3Aug 2026: 11,686 first mapped, the most in one month so far; the total passes 100,000.
By state
Top 10 states by Flock-tagged plate readers, month by month. Bars scale to the leader; tap a state to follow it.
Show the numbers as a table
| Month | Flock-tagged | First mapped that month | Per 100,000 people | All plate readers | First mapped that month |
|---|---|---|---|---|---|
| Nov 7, 2026 | 116,710 | 568 | 34.1 | 145,670 | – |
| Oct 2026 | 116,142 | 2,967 | 34.0 | 145,670 * | 3,208 * |
| Sep 2026 | 113,175 | 4,802 | 33.1 | 141,952 * | 7,368 * |
| Aug 2026 | 108,373 | 11,686 | 31.7 | 136,137 * | 15,726 * |
| Jul 2026 | 96,687 | 11,341 | 28.3 | 122,016 * | 13,716 * |
| Jun 2026 | 85,346 | 7,337 | 25.0 | 109,905 | 10,640 |
| May 2026 | 78,009 | 5,752 | 22.8 | 100,459 | 8,283 |
| Apr 2026 | 72,257 | 5,501 | 21.1 | 92,957 | 7,623 |
| Mar 2026 | 66,756 | 5,773 | 19.5 | 85,952 | 7,465 |
| Feb 2026 | 60,983 | 5,802 | 17.8 | 78,936 | 7,234 |
| Jan 2026 | 55,181 | 6,967 | 16.1 | 72,345 | 9,582 |
| Dec 2025 | 48,214 | 8,737 | 14.1 | 63,583 | 11,483 |
| Nov 2025 | 39,477 | 9,312 | 11.6 | 52,739 | 13,183 |
| Oct 2025 | 30,165 | 4,500 | 8.8 | 40,703 | 6,566 |
| Sep 2025 | 25,665 | 4,280 | 7.5 | 34,443 | 5,662 |
| Aug 2025 | 21,385 | 3,029 | 6.3 | 28,951 | 3,989 |
| Jul 2025 | 18,356 | 1,868 | 5.4 | 25,062 | 2,376 |
| Jun 2025 | 16,488 | 2,095 | 4.8 | 22,740 | 2,686 |
| May 2025 | 14,393 | 1,839 | 4.2 | 20,105 | 2,584 |
| Apr 2025 | 12,554 | 2,458 | 3.7 | 17,572 | 3,395 |
| Mar 2025 | 10,096 | 1,586 | 3.0 | 14,296 | 2,476 |
| Feb 2025 | 8,510 | 1,502 | 2.5 | 11,874 | 1,868 |
| Jan 2025 | 7,008 | 1,977 | 2.1 | 10,033 | 2,474 |
| Dec 2024 | 5,031 | 1,885 | 1.5 | 7,607 | 2,715 |
| Nov 2024 | 3,146 | 2,579 | 0.9 | 4,926 | 3,296 |
| Oct 2024 | 567 | 59 | 0.2 | 1,755 | 142 |
| Sep 2024 | 508 | 37 | 0.1 | 1,613 | 72 |
| Aug 2024 | 471 | 4 | 0.1 | 1,541 | 47 |
| Jul 2024 | 467 | 26 | 0.1 | 1,495 | 43 |
| Jun 2024 | 441 | 40 | 0.1 | 1,452 | 46 |
| May 2024 | 401 | 38 | 0.1 | 1,406 | 66 |
| Apr 2024 | 363 | 24 | 0.1 | 1,344 | 48 |
| Mar 2024 | 339 | 13 | 0.10 | 1,299 | 63 |
| Feb 2024 | 326 | 32 | 0.10 | 1,238 | 51 |
| Jan 2024 | 294 | 10 | 0.09 | 1,189 | 45 |
| Dec 2023 | 284 | 11 | 0.08 | 1,144 | 79 |
| Nov 2023 | 273 | 31 | 0.08 | 1,065 | 36 |
| Oct 2023 | 242 | 54 | 0.07 | 1,029 | 122 |
| Sep 2023 | 188 | 34 | 0.06 | 907 | 53 |
| Aug 2023 | 154 | 39 | 0.05 | 854 | 111 |
| Jul 2023 | 115 | 35 | 0.03 | 743 | 64 |
| Jun 2023 | 80 | 2 | 0.02 | 679 | 115 |
| May 2023 | 78 | 13 | 0.02 | 564 | 53 |
| Apr 2023 | 65 | 19 | 0.02 | 511 | 142 |
| Mar 2023 | 46 | 5 | 0.01 | 424 | 36 |
| Feb 2023 | 41 | 0 | 0.01 | 388 | 0 |
| Jan 2023 | 41 | 0 | 0.01 | 388 | 21 |
| Dec 2022 | 41 | 13 | 0.01 | 367 | – |
| Nov 2022 | 28 | 0 | 0.01 | – | – |
| Oct 2022 | 28 | 0 | 0.01 | – | – |
| Sep 2022 | 28 | 0 | 0.01 | – | – |
| Aug 2022 | 28 | 0 | 0.01 | – | – |
| Jul 2022 | 28 | 1 | 0.01 | – | – |
| Jun 2022 | 27 | 3 | 0.01 | – | – |
| May 2022 | 24 | 3 | 0.01 | – | – |
| Apr 2022 | 21 | 7 | 0.01 | – | – |
| Mar 2022 | 14 | 6 | 0.00 | – | – |
| Feb 2022 | 8 | 0 | 0.00 | – | – |
| Jan 2022 | 8 | 1 | 0.00 | – | – |
| Dec 2021 | 7 | 0 | 0.00 | – | – |
| Nov 2021 | 7 | 0 | 0.00 | – | – |
| Oct 2021 | 7 | 0 | 0.00 | – | – |
| Sep 2021 | 7 | 2 | 0.00 | – | – |
| Aug 2021 | 5 | 0 | 0.00 | – | – |
| Jul 2021 | 5 | 0 | 0.00 | – | – |
| Jun 2021 | 5 | 0 | 0.00 | – | – |
| May 2021 | 5 | 0 | 0.00 | – | – |
| Apr 2021 | 5 | 0 | 0.00 | – | – |
| Mar 2021 | 5 | 0 | 0.00 | – | – |
| Feb 2021 | 5 | 0 | 0.00 | – | – |
| Jan 2021 | 5 | 0 | 0.00 | – | – |
| Dec 2020 | 5 | 0 | 0.00 | – | – |
| Nov 2020 | 5 | 0 | 0.00 | – | – |
| Oct 2020 | 5 | 0 | 0.00 | – | – |
| Sep 2020 | 5 | 0 | 0.00 | – | – |
| Aug 2020 | 5 | 0 | 0.00 | – | – |
| Jul 2020 | 5 | 0 | 0.00 | – | – |
| Jun 2020 | 5 | 0 | 0.00 | – | – |
| May 2020 | 5 | 0 | 0.00 | – | – |
| Apr 2020 | 5 | 0 | 0.00 | – | – |
| Mar 2020 | 5 | 0 | 0.00 | – | – |
| Feb 2020 | 5 | 0 | 0.00 | – | – |
| Jan 2020 | 5 | 0 | 0.00 | – | – |
| Dec 2019 | 5 | 0 | 0.00 | – | – |
| Nov 2019 | 5 | 0 | 0.00 | – | – |
| Oct 2019 | 5 | 0 | 0.00 | – | – |
| Sep 2019 | 5 | 0 | 0.00 | – | – |
| Aug 2019 | 5 | 0 | 0.00 | – | – |
| Jul 2019 | 5 | 0 | 0.00 | – | – |
| Jun 2019 | 5 | 0 | 0.00 | – | – |
| May 2019 | 5 | 0 | 0.00 | – | – |
| Apr 2019 | 5 | 0 | 0.00 | – | – |
| Mar 2019 | 5 | 0 | 0.00 | – | – |
| Feb 2019 | 5 | 0 | 0.00 | – | – |
| Jan 2019 | 5 | 3 | 0.00 | – | – |
| Dec 2018 | 2 | 0 | 0.00 | – | – |
| Nov 2018 | 2 | 0 | 0.00 | – | – |
| Oct 2018 | 2 | 0 | 0.00 | – | – |
| Sep 2018 | 2 | 0 | 0.00 | – | – |
| Aug 2018 | 2 | 0 | 0.00 | – | – |
| Jul 2018 | 2 | 0 | 0.00 | – | – |
| Jun 2018 | 2 | 0 | 0.00 | – | – |
| May 2018 | 2 | 0 | 0.00 | – | – |
| Apr 2018 | 2 | 0 | 0.00 | – | – |
| Mar 2018 | 2 | 0 | 0.00 | – | – |
| Feb 2018 | 2 | 0 | 0.00 | – | – |
| Jan 2018 | 2 | 0 | 0.00 | – | – |
| Dec 2017 | 2 | 0 | 0.00 | – | – |
| Nov 2017 | 2 | 0 | 0.00 | – | – |
| Oct 2017 | 2 | 0 | 0.00 | – | – |
| Sep 2017 | 2 | 0 | 0.00 | – | – |
| Aug 2017 | 2 | 0 | 0.00 | – | – |
| Jul 2017 | 2 | 0 | 0.00 | – | – |
| Jun 2017 | 2 | 0 | 0.00 | – | – |
| May 2017 | 2 | 0 | 0.00 | – | – |
| Apr 2017 | 2 | 0 | 0.00 | – | – |
| Mar 2017 | 2 | 0 | 0.00 | – | – |
| Feb 2017 | 2 | 0 | 0.00 | – | – |
| Jan 2017 | 2 | 0 | 0.00 | – | – |
| State | Jan 2017 | Jan 2023 | Jan 2024 | Jan 2025 | Jan 2026 | Nov 7, 2026 | Per 100,000 people |
|---|---|---|---|---|---|---|---|
| California | 0 | 5 | 9 | 1,663 | 8,460 | 17,265 | 43.9 |
| Texas | 1 | 1 | 2 | 549 | 6,928 | 16,026 | 50.5 |
| Georgia | 0 | 10 | 10 | 456 | 4,093 | 9,464 | 83.7 |
| Florida | 1 | 1 | 3 | 315 | 3,179 | 7,187 | 30.6 |
| Ohio | 0 | 21 | 59 | 407 | 3,322 | 6,315 | 53.1 |
| Illinois | 0 | 0 | 152 | 556 | 3,169 | 5,889 | 46.3 |
| Indiana | 0 | 0 | 0 | 146 | 1,792 | 3,446 | 49.4 |
| North Carolina | 0 | 0 | 0 | 71 | 1,383 | 3,442 | 30.7 |
| Tennessee | 0 | 0 | 0 | 123 | 1,294 | 3,218 | 44.0 |
| Virginia | 0 | 2 | 2 | 388 | 1,739 | 3,078 | 34.7 |
| Michigan | 0 | 1 | 35 | 591 | 2,249 | 3,016 | 29.8 |
| Alabama | 0 | 0 | 0 | 189 | 1,313 | 2,577 | 49.6 |
| Missouri | 0 | 0 | 2 | 66 | 1,179 | 2,565 | 40.9 |
| Colorado | 0 | 0 | 0 | 177 | 1,430 | 2,338 | 38.9 |
| Arizona | 0 | 0 | 0 | 50 | 1,243 | 2,181 | 28.6 |
| Washington | 0 | 0 | 0 | 42 | 1,154 | 2,160 | 27.0 |
| New York | 0 | 0 | 0 | 20 | 864 | 2,153 | 10.8 |
| South Carolina | 0 | 0 | 0 | 23 | 759 | 1,975 | 35.5 |
| Wisconsin | 0 | 0 | 0 | 363 | 1,149 | 1,834 | 30.7 |
| Kentucky | 0 | 0 | 0 | 238 | 865 | 1,828 | 39.7 |
| Louisiana | 0 | 0 | 0 | 127 | 844 | 1,807 | 39.1 |
| Minnesota | 0 | 0 | 0 | 26 | 658 | 1,480 | 25.4 |
| Pennsylvania | 0 | 0 | 0 | 4 | 333 | 1,409 | 10.8 |
| Kansas | 0 | 0 | 0 | 60 | 602 | 1,323 | 44.4 |
| Oklahoma | 0 | 0 | 20 | 164 | 573 | 1,244 | 30.2 |
| New Jersey | 0 | 0 | 0 | 14 | 471 | 1,233 | 12.9 |
| Mississippi | 0 | 0 | 0 | 10 | 224 | 1,004 | 34.0 |
| Arkansas | 0 | 0 | 0 | 13 | 308 | 988 | 31.7 |
| Massachusetts | 0 | 0 | 0 | 20 | 424 | 972 | 13.6 |
| Iowa | 0 | 0 | 0 | 16 | 496 | 816 | 25.2 |
| Utah | 0 | 0 | 0 | 9 | 349 | 814 | 23.0 |
| Nevada | 0 | 0 | 0 | 1 | 308 | 759 | 23.1 |
| Maryland | 0 | 0 | 0 | 3 | 281 | 740 | 11.8 |
| New Mexico | 0 | 0 | 0 | 3 | 324 | 709 | 33.4 |
| Connecticut | 0 | 0 | 0 | 18 | 327 | 659 | 17.9 |
| Nebraska | 0 | 0 | 0 | 5 | 156 | 418 | 20.7 |
| Delaware | 0 | 0 | 0 | 7 | 136 | 412 | 38.9 |
| Oregon | 0 | 0 | 0 | 34 | 172 | 357 | 8.4 |
| Idaho | 0 | 0 | 0 | 0 | 147 | 350 | 17.2 |
| Rhode Island | 0 | 0 | 0 | 30 | 147 | 291 | 26.1 |
| South Dakota | 0 | 0 | 0 | 4 | 47 | 253 | 27.1 |
| West Virginia | 0 | 0 | 0 | 2 | 48 | 192 | 10.9 |
| North Dakota | 0 | 0 | 0 | 0 | 69 | 124 | 15.5 |
| Washington, DC | 0 | 0 | 0 | 0 | 50 | 92 | 13.3 |
| Montana | 0 | 0 | 0 | 0 | 22 | 72 | 6.3 |
| Wyoming | 0 | 0 | 0 | 5 | 49 | 67 | 11.4 |
| Hawaii | 0 | 0 | 0 | 0 | 22 | 64 | 4.5 |
| Maine | 0 | 0 | 0 | 0 | 23 | 46 | 3.3 |
| Alaska | 0 | 0 | 0 | 0 | 0 | 25 | 3.4 |
| Vermont | 0 | 0 | 0 | 0 | 7 | 18 | 2.8 |
| New Hampshire | 0 | 0 | 0 | 0 | 0 | 15 | 1.1 |

How the months are counted
First mapped is the day a reader was added to the map, not the day it went up. Flock-tagged: each point counts the Flock-tagged plate readers on the map on Nov 7, 2026 that were first mapped by the end of that month. Flock-tagged means Flock Safety is entered as the maker or brand. 0% of them were edited after they were added, so OpenStreetMap kept no first date. Their month comes from their OpenStreetMap ID, because IDs are handed out in time order. Before 2023 the line is approximate: a point added back then may have been tagged as a Flock reader later. The 1 drawn as outlines have no date, so they count from the first month. All plate readers: the count on the 1st of each month from the full OpenStreetMap history, from January 2023. It includes readers removed since. The counts from the end of July 2026 on are estimated until that history catches up. The last point is the Nov 7, 2026 snapshot. The two lines count in different ways. At the end of December 2022, the Flock line shows 41 and all plate readers show 367. Between months, the chart draws a smooth curve through the monthly counts. There are no weekly numbers. Per 100,000 people uses the Census Bureau's 2025 population estimates.
Flock cameras by state


| # | State | Flock-tagged | Since Jan 2023 | All plate readers |
|---|---|---|---|---|
| 1 | California of 21,701 plate readers | 17,265 | 5 at the end of January 2023 | 21,701 |
| 2 | Texas of 17,539 plate readers | 16,026 | 1 at the end of January 2023 | 17,539 |
| 3 | Georgia of 10,360 plate readers | 9,464 | 10 at the end of January 2023 | 10,360 |
| 4 | Florida of 9,580 plate readers | 7,187 | 1 at the end of January 2023 | 9,580 |
| 5 | Ohio of 6,988 plate readers | 6,315 | 21 at the end of January 2023 | 6,988 |
| 6 | Illinois of 7,674 plate readers | 5,889 | 0 at the end of January 2023 | 7,674 |
| 7 | Indiana of 3,850 plate readers | 3,446 | 0 at the end of January 2023 | 3,850 |
| 8 | North Carolina of 3,976 plate readers | 3,442 | 0 at the end of January 2023 | 3,976 |
| 9 | Tennessee of 3,712 plate readers | 3,218 | 0 at the end of January 2023 | 3,712 |
| 10 | Virginia of 3,408 plate readers | 3,078 | 2 at the end of January 2023 | 3,408 |
| 11 | Michigan of 3,675 plate readers | 3,016 | 1 at the end of January 2023 | 3,675 |
| 12 | Alabama of 3,040 plate readers | 2,577 | 0 at the end of January 2023 | 3,040 |
| 13 | Missouri of 3,521 plate readers | 2,565 | 0 at the end of January 2023 | 3,521 |
| 14 | Colorado of 2,779 plate readers | 2,338 | 0 at the end of January 2023 | 2,779 |
| 15 | Arizona of 2,677 plate readers | 2,181 | 0 at the end of January 2023 | 2,677 |
| 16 | Washington of 2,637 plate readers | 2,160 | 0 at the end of January 2023 | 2,637 |
| 17 | New York of 4,820 plate readers | 2,153 | 0 at the end of January 2023 | 4,820 |
| 18 | South Carolina of 2,174 plate readers | 1,975 | 0 at the end of January 2023 | 2,174 |
| 19 | Wisconsin of 2,096 plate readers | 1,834 | 0 at the end of January 2023 | 2,096 |
| 20 | Kentucky of 1,881 plate readers | 1,828 | 0 at the end of January 2023 | 1,881 |
| 21 | Louisiana of 2,340 plate readers | 1,807 | 0 at the end of January 2023 | 2,340 |
| 22 | Minnesota of 1,708 plate readers | 1,480 | 0 at the end of January 2023 | 1,708 |
| 23 | Pennsylvania of 3,983 plate readers | 1,409 | 0 at the end of January 2023 | 3,983 |
| 24 | Kansas of 2,089 plate readers | 1,323 | 0 at the end of January 2023 | 2,089 |
| 25 | Oklahoma of 1,548 plate readers | 1,244 | 0 at the end of January 2023 | 1,548 |
| 26 | New Jersey of 2,472 plate readers | 1,233 | 0 at the end of January 2023 | 2,472 |
| 27 | Mississippi of 1,180 plate readers | 1,004 | 0 at the end of January 2023 | 1,180 |
| 28 | Arkansas of 1,111 plate readers | 988 | 0 at the end of January 2023 | 1,111 |
| 29 | Massachusetts of 1,217 plate readers | 972 | 0 at the end of January 2023 | 1,217 |
| 30 | Iowa of 884 plate readers | 816 | 0 at the end of January 2023 | 884 |
| 31 | Utah of 1,076 plate readers | 814 | 0 at the end of January 2023 | 1,076 |
| 32 | Nevada of 998 plate readers | 759 | 0 at the end of January 2023 | 998 |
| 33 | Maryland of 1,023 plate readers | 740 | 0 at the end of January 2023 | 1,023 |
| 34 | New Mexico of 1,040 plate readers | 709 | 0 at the end of January 2023 | 1,040 |
| 35 | Connecticut of 1,052 plate readers | 659 | 0 at the end of January 2023 | 1,052 |
| 36 | Nebraska of 659 plate readers | 418 | 0 at the end of January 2023 | 659 |
| 37 | Delaware of 522 plate readers | 412 | 0 at the end of January 2023 | 522 |
| 38 | Oregon of 552 plate readers | 357 | 0 at the end of January 2023 | 552 |
| 39 | Idaho of 485 plate readers | 350 | 0 at the end of January 2023 | 485 |
| 40 | Rhode Island of 320 plate readers | 291 | 0 at the end of January 2023 | 320 |
| 41 | South Dakota of 284 plate readers | 253 | 0 at the end of January 2023 | 284 |
| 42 | West Virginia of 242 plate readers | 192 | 0 at the end of January 2023 | 242 |
| 43 | North Dakota of 170 plate readers | 124 | 0 at the end of January 2023 | 170 |
| 44 | Washington, DC of 113 plate readers | 92 | 0 at the end of January 2023 | 113 |
| 45 | Montana of 89 plate readers | 72 | 0 at the end of January 2023 | 89 |
| 46 | Wyoming of 73 plate readers | 67 | 0 at the end of January 2023 | 73 |
| 47 | Hawaii of 103 plate readers | 64 | 0 at the end of January 2023 | 103 |
| 48 | Maine of 106 plate readers | 46 | 0 at the end of January 2023 | 106 |
| 49 | Alaska of 31 plate readers | 25 | 0 at the end of January 2023 | 31 |
| 50 | Vermont of 32 plate readers | 18 | 0 at the end of January 2023 | 32 |
| 51 | New Hampshire of 80 plate readers | 15 | 0 at the end of January 2023 | 80 |
Cities with the most Flock-tagged plate readers
Who runs Flock-tagged plate readers
Some Flock-tagged plate readers name an operator. Most don't say who runs them. The list shows the tagged ones only.
Who can access Flock camera data · Flock cameras in the UK · Find your agency's transparency portal
What Flock cameras keep
- Records
- The plate of each car that passes, with the time and place. Often a photo of the car.
- Run by
- Most don't say. Tagged ones include private operators (3,513).
- Kept for
- Not published on the map. Each operator sets its own. Flock Safety’s FAQ: “Flock recommends a 7-day default.”
- Who sees it
- Whoever runs it, and those it shares with. In California, a public agency may share only with other public agencies in the state.
- How to ask
- Read the operator's policy. California requires one. Or ask the city for its records.
Flock cameras: questions
What is a Flock camera?
A Flock camera is a license plate reader made by Flock Safety, and it reads plates, not speed. Flock Safety’s FAQ says: “The customer sets its own data retention period, based on its own policy and applicable law.” It adds: “Flock recommends a 7-day default.” 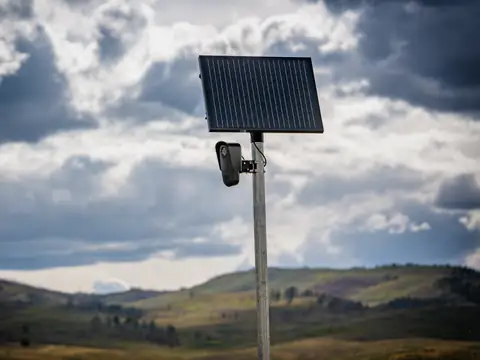 What a Flock camera looks likePhoto: Tony Webster, CC BY 4.0, cropped.

Where are Flock cameras located?
116,710 plate readers tagged Flock Safety are on the map in 50 states and DC. The map shows each one, and each state page lists its own.
How many Flock cameras are there?
116,710 plate readers tagged Flock Safety are on the map, as of November 7, 2026. Flock has said it runs more than 120,000 cameras nationwide. The Intercept reported on September 24, 2026, that a December 2025 snapshot of Flock’s own records showed more than 170,000. This map shows only the mapped ones.
Does a dot on the map mean a camera is there today?
Not always. A dot shows where a volunteer mapped a camera. Each point shows the date it was first mapped and, when tagged, the date someone last checked it on the ground.
Can the public see Flock camera footage or a live feed?
Not on CamsAhead. It shows where Flock cameras are mapped, never what they record. Whoever runs each camera decides who can search its records, within state law.
Is there a public Flock camera database?
Yes for locations, not for what the cameras record. The mapped locations come from OpenStreetMap, and CamsAhead sends a free copy of its plate reader data on request, under the ODbL. It holds points and tags, never plates.
Is there a Flock camera tracker or locator?
Yes, the map on this page is one. It shows 116,710 plate readers tagged Flock Safety. Search a place or tap Near me to see the closest ones. Drive (Beta) chimes near mapped plate readers in Los Angeles County: Flock camera app.
Plate reader data
Show how to get and credit this data
The data is built from OpenStreetMap and uses the Open Database License (ODbL) 1.0. CamsAhead sends a free copy to anyone who asks (how it is made and how to ask). When you share it, credit "© OpenStreetMap contributors" and keep the license.
- Alabama 3,040 plate readers
- Alaska 31 plate readers
- Arizona 2,677 plate readers
- Arkansas 1,111 plate readers
- California 21,701 plate readers
- Colorado 2,779 plate readers
- Connecticut 1,052 plate readers
- Delaware 522 plate readers
- Washington, DC 113 plate readers
- Florida 9,580 plate readers
- Georgia 10,360 plate readers
- Hawaii 103 plate readers
- Idaho 485 plate readers
- Illinois 7,674 plate readers
- Indiana 3,850 plate readers
- Iowa 884 plate readers
- Kansas 2,089 plate readers
- Kentucky 1,881 plate readers
- Louisiana 2,340 plate readers
- Maine 106 plate readers
- Maryland 1,023 plate readers
- Massachusetts 1,217 plate readers
- Michigan 3,675 plate readers
- Minnesota 1,708 plate readers
- Mississippi 1,180 plate readers
- Missouri 3,521 plate readers
- Montana 89 plate readers
- Nebraska 659 plate readers
- Nevada 998 plate readers
- New Hampshire 80 plate readers
- New Jersey 2,472 plate readers
- New Mexico 1,040 plate readers
- New York 4,820 plate readers
- North Carolina 3,976 plate readers
- North Dakota 170 plate readers
- Ohio 6,988 plate readers
- Oklahoma 1,548 plate readers
- Oregon 552 plate readers
- Pennsylvania 3,983 plate readers
- Rhode Island 320 plate readers
- South Carolina 2,174 plate readers
- South Dakota 284 plate readers
- Tennessee 3,712 plate readers
- Texas 17,539 plate readers
- Utah 1,076 plate readers
- Vermont 32 plate readers
- Virginia 3,408 plate readers
- Washington 2,637 plate readers
- West Virginia 242 plate readers
- Wisconsin 2,096 plate readers
- Wyoming 73 plate readers
Know when cameras near you change.
Free email alerts for new plate readers mapped near your places. One summary email a month.
- When a plate reader is first mapped near you
- New cameras mapped or reported near you
- What plate readers keep, and who runs them
- Your street, your distance, the camera types you pick
156,883 cameras listed or mapped so far.
Sources and updates
- OpenStreetMap contributors: objects tagged surveillance:type=ALPR, data as of Nov 7, 2026; ODbL 1.0
- Flock Safety FAQ: the maker's own words, quoted, read Oct 24, 2026
- California Civil Code §1798.90.51: the use and privacy policy rule for plate readers
- California Civil Code §1798.90.55: the rule on who a public agency may share reads with
- ohsome (HeiGIT): monthly counts of all plate readers from the full OpenStreetMap history, for the growth chart
- The Intercept: Flock camera totals as reported, Sep 24, 2026
- US Census Bureau: Vintage 2025 state population (per 100,000 people) and 2025 state boundaries (state icons)
Plate reader points are mapped by OpenStreetMap volunteers (data as of November 7, 2026).
Cite this page: “Flock Cameras: Map of 116,710 Locations in DC and 50 States”, CamsAhead.com, https://camsahead.com/flock-cameras/, updated November 7, 2026.
How CamsAhead counts cameras · Report a problem · Report a camera