
 CamsAhead.com
Average speed cameras in the UK
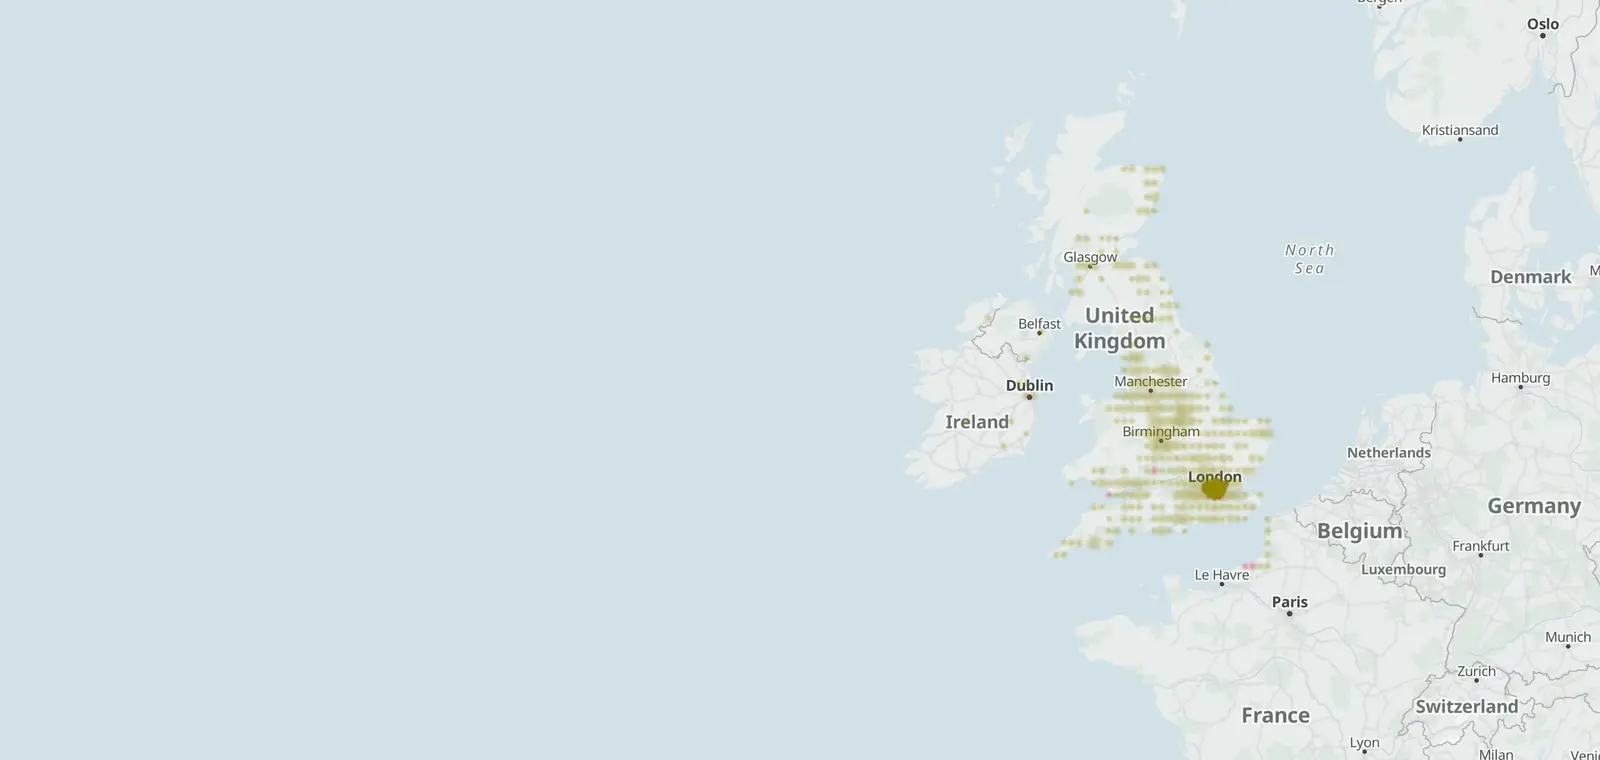
384 average speed cameras among the 3,825 speed cameras mapped in the UK.
© OpenStreetMap contributors (ODbL) · © OpenMapTiles
An average speed camera reads a car's number plate at the start of a stretch of road and again at the end. Then it works out the average speed. 80 average speed sections and 384 average speed cameras are mapped in the UK. The A683 has the most sections, 13, as of 26 October 2026.
How average speed cameras work
Cameras at each end of a section read the number plate of each car. The time between the two reads gives the car's average speed over the section.
In England and Wales, government guidance puts them on longer roads where crashes are spread out, and at major roadworks. They calm speeds over the whole stretch, not just at one spot.
Mapped average speed sections by road
70 of the 80 mapped sections sit on 28 motorways and A roads. The table counts the sections on each road, their length and their posted limit.
| Road | Sections | Miles | Posted limit |
|---|---|---|---|
| A683 Westmorland and Furness, Lancaster | 13 | 12.9 | |
| A52 Boston, East Lindsey, Rushcliffe | 6 | 11.8 | 40 mph, 50 mph, 60 mph, 70 mph |
| A631 Bassetlaw | 6 | 7.1 | 50 mph |
| A611 Ashfield | 6 | 1.2 | |
| A149 North Norfolk, King's Lynn and West Norfolk | 3 | 14.2 | 50 mph, 60 mph |
| A40 Hammersmith and Fulham, Kensington and Chelsea, Westminster | 3 | 5.3 | 30 mph, 40 mph |
| A6 Preston, South Ribble, Lancaster | 3 | 1.8 | 30 mph, 40 mph |
| A620 Bassetlaw | 2 | 8.2 | 50 mph |
| A77 South Ayrshire | 2 | 5.5 | |
| A588 Lancaster | 2 | 3.4 | 30 mph |
| A28 Thanet | 2 | 2.4 | |
| A64 Leeds | 2 | 1.6 | 40 mph |
| A16 East Lindsey | 2 | 1.3 | 30 mph, 50 mph |
| A1081 Central Bedfordshire, Luton | 2 | 1.0 | 50 mph |
| A60 Nottingham | 2 | 0.4 | 30 mph |
| A59 Preston, South Ribble | 2 | 40 mph | |
| A17 King's Lynn and West Norfolk | 1 | 7.1 | 60 mph |
| A272 East Hampshire, Winchester | 1 | 6.8 | |
| A6006 Rushcliffe | 1 | 4.1 | 50 mph |
| A134 West Suffolk | 1 | 3.7 | 60 mph |
| A101 Southwark, Tower Hamlets | 1 | 1.3 | 20 mph |
| A25 Guildford | 1 | 1.1 | 40 mph |
| M4 Hounslow | 1 | 0.7 | 40 mph |
| A281 Waverley | 1 | 0.5 | 30 mph |
| A1121 Boston | 1 | 0.2 | 40 mph |
| A14 Babergh, Ipswich | 1 | 60 mph | |
| A47 Broadland, Great Yarmouth | 1 | 50 mph | |
| A494 Flintshire | 1 | 50 mph |
10 more sections sit on smaller roads with no M or A number.
Roads with the most average speed cameras
Some average speed cameras are mapped as single points, with no section drawn between them. These are the roads with the most average speed cameras on the map.
| Road | Cameras | Sections |
|---|---|---|
| A683 | 29 | 13 |
| A77 | 27 | 2 |
| A47 | 26 | 1 |
| A6514 | 23 | 0 |
| A52 | 16 | 6 |
| A38 | 15 | 0 |
| A149 | 12 | 3 |
| A610 | 12 | 0 |
| A611 | 12 | 6 |
| A631 | 12 | 6 |
| A4540 | 10 | 0 |
| A60 | 9 | 2 |
Each road page counts its cameras by kind. A road with no mapped section says so, so the motorways' pages show counts and limits only.
Average speed cameras by nation
Each row counts one nation's average speed cameras and mapped sections.
| Nation | Cameras | Sections |
|---|---|---|
| England | 337 | 75 |
| Scotland | 33 | 4 |
| Wales | 14 | 1 |
| Northern Ireland | 0 | 0 |
Speed cameras on UK motorways and A roads · Types of speed cameras in the UK · Speed cameras in the UK
Sources and updates
- OpenStreetMap contributors: speed, average speed, red light and other enforcement cameras, and the motorways and A roads they sit on, data as of 26 October 2026; ODbL 1.0
- Transport for London (London Safety Camera Partnership): London's speed and red light camera sites, read 7 November 2026. Powered by TfL Open Data. Contains OS data © Crown copyright and database rights 2016 and Geomni UK Map data © and database rights [2019]; TfL Transport Data Service licence (Open Government Licence v2.0 with TfL amendments)
- Office for National Statistics: Local Authority Districts (May 2026) Boundaries UK BGC (generalised 20 m, clipped to the coastline), and the English regions, which place each camera. Source: Office for National Statistics licensed under the Open Government Licence v.3.0. Contains OS data © Crown copyright and database right 2026.
- Natural Earth: the UK outline on the map, 1:50m (public domain)
- Department for Transport, Circular 01/2007: Use of speed and red-light cameras for traffic enforcement: guidance on deployment, visibility and signing (31 January 2007, England and Wales): where average speed cameras are used, read 27 October 2026
Cite this page: “Average Speed Cameras UK: How They Work, 80 Mapped Sections”, CamsAhead.com, https://camsahead.com/uk/average-speed-cameras/, updated 7 November 2026.
How CamsAhead counts cameras · Report a problem · Report a camera